
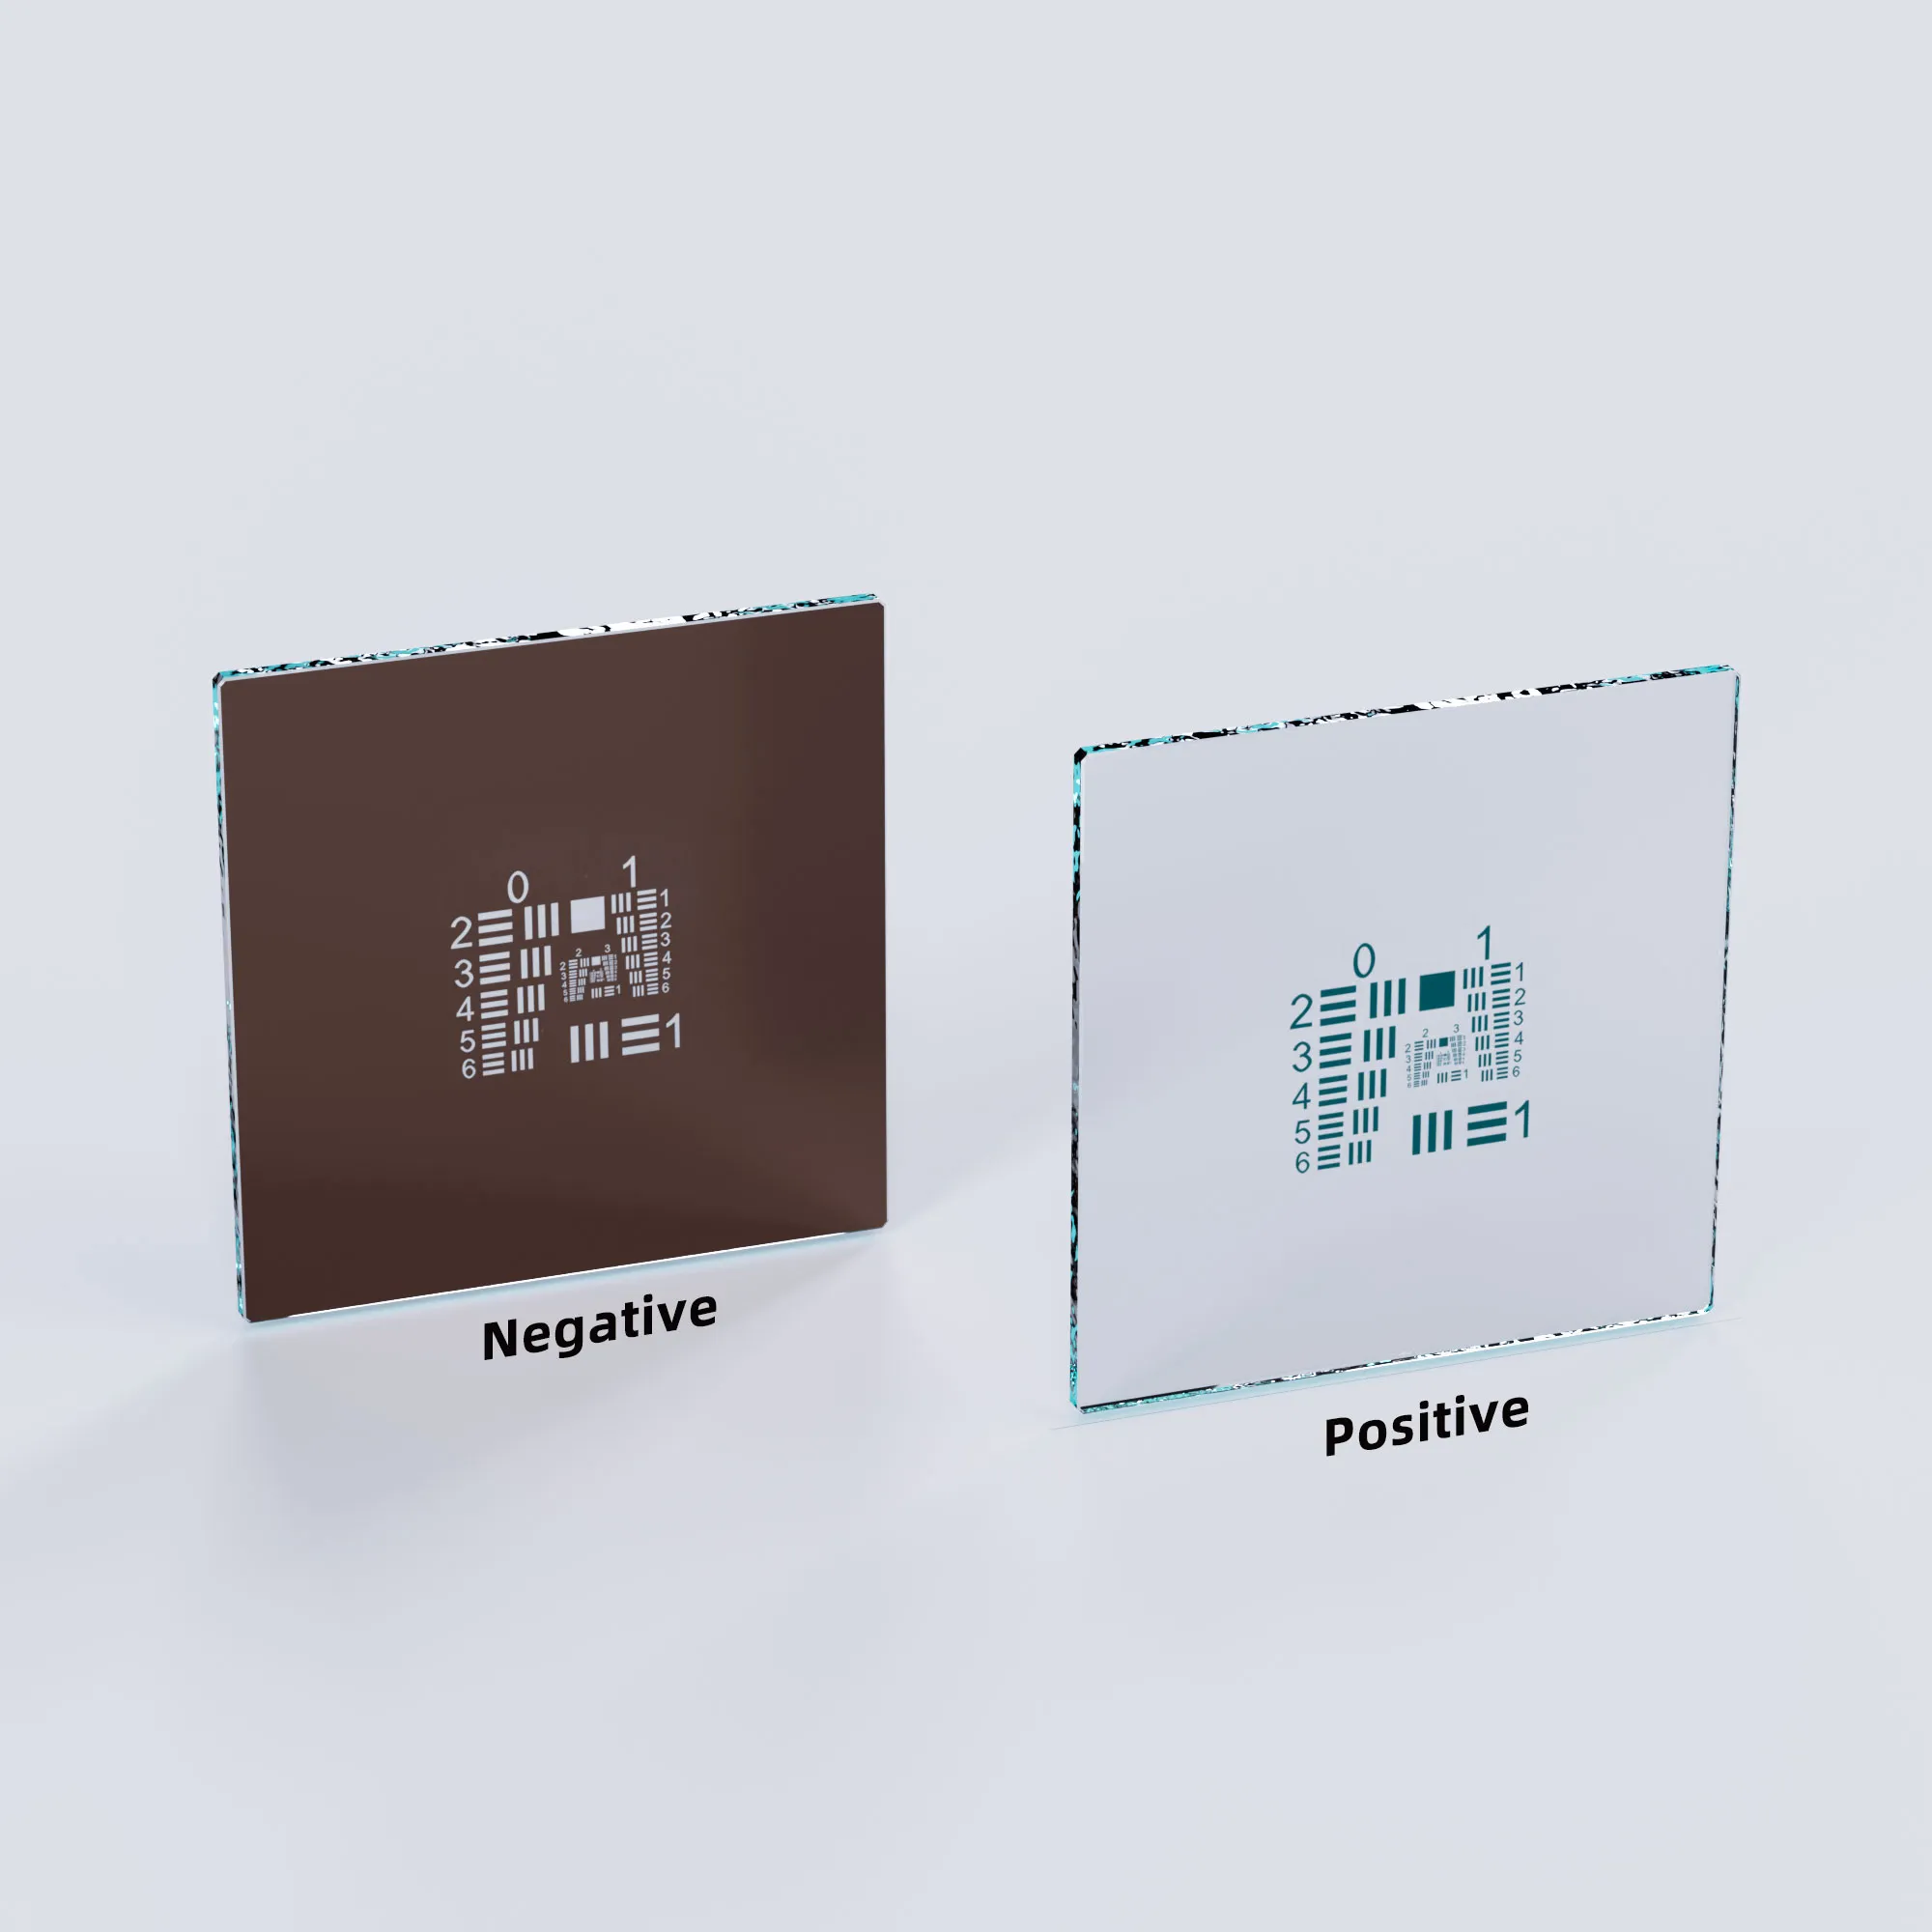
A USAF 1951 test target is a practical tool for measuring the limiting resolution of an optical imaging system.
The basic method is straightforward:
Image the target under controlled conditions, find the highest-frequency group and element where the individual bars remain resolved, then convert that group and element into line pairs per millimeter (lp/mm).
The higher the spatial frequency that can still be resolved, the higher the measured resolving capability of the imaging system.
However, the result must be interpreted correctly. In most practical setups, a USAF target measures the resolution of the complete imaging system—including the lens, focus, sensor, magnification, illumination, and image processing—not the lens alone.
What Does a USAF 1951 Test Target Measure?
A USAF 1951 target contains groups of horizontal and vertical bar patterns with progressively smaller line spacing.
Each pattern corresponds to a known spatial frequency.
The chart is commonly used to evaluate:
- Optical system resolution
- Machine vision imaging resolution
- Microscope resolution
- Lens and camera system performance
- Focus quality
- Resolution consistency across the field of view
A USAF 1951 resolution chart is particularly useful when the goal is to determine the finest bar pattern an imaging system can still distinguish.
The result is usually expressed in:
line pairs per millimeter (lp/mm)
One line pair consists of one dark line and one light line.
As the number of line pairs per millimeter increases, the features become smaller and more difficult for the imaging system to resolve.
How Is a USAF 1951 Resolution Chart Organized?
A standard USAF 1951 pattern is divided into groups, and each group contains six elements.
Within each group:
- Element 1 has the lowest spatial frequency
- Element 6 has the highest spatial frequency
The next group continues with finer features.
Each element includes horizontal and vertical bar patterns so resolution can be evaluated in both orientations.
How to Set Up a USAF 1951 Resolution Test
The quality of the result depends heavily on the test setup.
The target should be tested under conditions that represent the imaging system you actually want to evaluate.
Step 1: Position the USAF 1951 Test Target
Place the target at the object plane where the real inspection object or sample would normally be located.
The target should be:
- Flat
- Stable
- Properly aligned
- Positioned at the intended working distance
For tests where the target is intended to face the optical system directly, avoid unnecessary tilt. Tilt can place different portions of the target at different focus distances and distort the result.
For microscope or high-resolution optical work, a suitable target such as a USAF 1951 Chrome-on-Glass Microscope Calibration Target can be used when its feature range and construction match the application.
Step 2: Use Appropriate Illumination
Use sufficient and reasonably uniform illumination.
Avoid:
- Strong glare
- Uneven illumination
- Saturated bright regions
- Underexposed dark regions
Keep illumination conditions consistent when comparing lenses, cameras, or optical configurations.
Otherwise, changes in contrast may be mistaken for changes in resolution.
Step 3: Focus the Imaging System Carefully
Focus is one of the most important variables in a USAF resolution test.
Focus the system under the same operating conditions used in the real application.
If the purpose is to compare different lenses or camera configurations, use the same focusing method for every test.
If center-to-edge image performance matters, repeat the measurement at multiple positions in the field of view rather than judging only the center.
Step 4: Find the Finest Resolvable Element
Start with a coarse pattern and move toward progressively finer elements.
The limiting element is the highest-frequency pattern that still meets your chosen resolution criterion.
For visual evaluation, establish a consistent rule for when individual bars are considered resolved and apply that rule to every comparison.
Check both:
Horizontal bars
and:
Vertical bars
If one orientation remains resolved to a higher spatial frequency than the other, record the two results separately.
Do not count a pattern as resolved simply because a faint texture is visible. The individual bar structure must still be distinguishable according to the same criterion used throughout the test.
How Do You Convert a USAF Group and Element to lp/mm?
For a standard USAF 1951 pattern, spatial frequency can be calculated from the group number and element number.
The commonly used relationship is:
Resolution (lp/mm) = 2^(Group + (Element − 1) / 6)
where:
- Group = USAF group number
- Element = element number from 1 to 6
For example, if the finest resolved pattern is:
Group 3, Element 1
then:
Resolution = 2³ = 8 lp/mm
Finer elements within the same group correspond to progressively higher spatial frequencies.
This allows a USAF resolution test chart to convert a visual resolution result into a numerical spatial-frequency value.
How Do You Convert lp/mm Into Feature Size?
Sometimes it is more useful to express the result as a physical feature size.
If the measured resolution is:
R lp/mm
then one complete line-pair period is:
1 / R mm
For an ideal USAF bar pattern in which the dark line and light space have equal widths, the approximate width of one individual line is:
1 / (2R) mm
or:
Line width (µm) = 1000 / (2R)
For example, at:
100 lp/mm
the corresponding dimensions are approximately:
- Line-pair period = 10 µm
- Individual line width = 5 µm
This conversion is useful when comparing the test result with the physical feature sizes that must be resolved in a machine vision or microscopy application.
Does the USAF 1951 Test Measure Lens Resolution Alone?
Usually, no.
When a camera images a USAF 1951 test target, the measured result is influenced by the complete imaging chain, including:
- Lens resolution
- Optical aberrations
- Focus
- Aperture
- Sensor pixel size
- Optical magnification
- Sensor sampling
- Illumination
- Image processing
The measured lp/mm should therefore normally be described as the system resolution under the stated test conditions.
A lens resolution chart can be used to compare lenses, but the camera, sensor, magnification, illumination, and image-processing conditions should remain controlled if the objective is to isolate lens differences.
How Do Sensor Sampling and Magnification Affect the Result?
Sensor sampling and optical magnification must be considered together.
A lens may form very fine image detail, but the camera sensor must sample that detail with enough pixels for it to be represented reliably.
Important factors include:
- Sensor pixel size
- Optical magnification
- Number of pixels covering each line pair
- Camera demosaicing, where applicable
- Digital sharpening or rescaling
The lp/mm value calculated from the USAF target refers to the spatial frequency at the target itself, or object space.
When comparing this result with sensor sampling, the target feature size must be mapped through the optical magnification to determine how large that feature appears at the sensor.
For example, higher magnification makes a given object-space feature occupy more sensor pixels, while lower magnification makes the same feature occupy fewer pixels.
This is why two systems using the same target can produce different measured limits even when their lenses appear similar.
For meaningful comparisons, keep these conditions consistent whenever possible:
- Working distance
- Magnification
- Sensor
- Image resolution
- Aperture
- Focus
- Illumination
- Image processing
Avoid changing sharpening or rescaling between tests, because software processing can alter apparent edge clarity without increasing true optical detail.
Why Should You Check Both Horizontal and Vertical Bars?
A USAF target includes bar patterns in different orientations because resolution can vary with direction.
Possible causes include:
- Astigmatism
- Lens alignment
- Sensor sampling
- Motion blur
- Directional vibration
- Focus differences
- Image processing
If horizontal features resolve to a higher spatial frequency than vertical features, record both values.
This directional difference can provide useful diagnostic information about the imaging system.
How to Use a USAF 1951 Test Target for Machine Vision
For machine vision, the most useful test is one that reproduces the actual inspection conditions.
Use the same camera, lens, working distance, aperture, lighting, exposure, focus, and image-processing settings as the real inspection whenever practical.
Place the target in the actual inspection plane.
A USAF 1951 Test Target can then be used to determine whether the complete imaging system can resolve features comparable to those required by the inspection task.
If the application must distinguish small defects, edges, or markings, compare the required feature size with the measured object-space resolution.
For systems with a wide field of view, resolution should also be checked at relevant positions rather than only at the image center.
How to Use a USAF 1951 Test Target With a Microscope
The same measurement principle applies to microscopy, but target feature size and sampling become especially important.
A microscope test should use a target whose finest patterns are small enough to challenge the optical system.
Important conditions include:
- Objective magnification
- Numerical aperture
- Illumination
- Focus
- Camera sampling
- Target position
- Target feature quality
If the target is too coarse, even a high-resolution microscope may resolve every available element, making it impossible to determine the actual resolution limit.
As feature sizes become smaller, the dimensional accuracy and edge quality of the target become increasingly important.
What Other Factors Can Affect the Measured Resolution?
Several additional factors can change the measured result even when the camera and lens remain unchanged.
Aperture
Changing the aperture can alter diffraction, optical aberrations, depth of field, and image contrast.
A system may therefore produce different resolution results at different f-numbers.
Motion and Vibration
Camera motion, target motion, or machine vibration can blur fine bar patterns.
Directional motion can also affect horizontal and vertical resolution differently.
Target Quality
The target itself must have sufficiently accurate feature dimensions, edge quality, and contrast.
If the target cannot reproduce features accurately at the spatial frequencies being tested, it can become the limiting factor in the measurement.
An optical resolution test chart should therefore provide a usable feature range for the optical system being evaluated.
Alignment and Field Position
Target alignment and field position can affect the result.
For systems with significant field curvature or off-axis aberrations, center resolution may differ substantially from edge resolution.
Common Mistakes When Using a USAF 1951 Test Target
Mistake 1: Recording the Smallest Visible Pattern Instead of the Smallest Resolved Pattern
A faint pattern is not necessarily a resolved pattern. Use the same resolution criterion throughout the test.
Mistake 2: Ignoring Horizontal and Vertical Differences
Record both orientations when their limiting resolutions differ.
Mistake 3: Changing Focus Between Comparisons
Use a consistent focusing method when comparing lenses or systems.
Mistake 4: Ignoring Magnification
Magnification changes how target features are sampled by the sensor.
Mistake 5: Using Inconsistent Image Processing
Sharpening, denoising, contrast enhancement, and rescaling can alter apparent resolution.
Mistake 6: Assuming the Result Represents Only the Lens
The complete imaging system contributes to the measured result.
Mistake 7: Using a Target That Is Too Coarse
If the finest available pattern is still easily resolved, the target cannot determine the true limiting resolution of the system.
Is a USAF 1951 Test Target the Same as an MTF Test?
No.
A USAF 1951 target is particularly useful for evaluating limiting resolution using known bar-pattern spatial frequencies.
MTF testing measures how image contrast is transferred across a range of spatial frequencies.
In simple terms:
USAF 1951 → practical limiting-resolution measurement
MTF → quantitative contrast-versus-spatial-frequency characterization
A USAF target is therefore useful when the goal is to determine whether an imaging system can resolve a required feature size or to compare systems under controlled conditions.
USAF 1951 Test Target Measurement Checklist
Before recording the final result, confirm that:
- The target is positioned at the correct object plane
- The target is flat and properly aligned
- Illumination is stable
- Exposure is not saturated
- Focus is set consistently
- Magnification is known
- Camera settings remain fixed
- Image processing is controlled
- A consistent resolution criterion is used
- Horizontal and vertical bars are both checked
- The finest resolved group and element are recorded
- Group and element are converted to lp/mm
- Target spatial frequency is interpreted in object space
- Sensor sampling is considered through magnification
- The target resolution range is sufficient for the imaging system
These controls make comparisons between cameras, lenses, microscopes, and optical configurations much more meaningful.
Conclusion: How Do You Measure Optical Resolution With a USAF 1951 Test Target?
To measure optical resolution with a USAF 1951 test target:
- Place the target at the actual imaging plane.
- Use stable and appropriate illumination.
- Focus the optical system under representative operating conditions.
- Move from coarse to progressively finer USAF elements.
- Apply a consistent criterion to determine the highest-frequency resolved pattern.
- Record the limiting group and element for horizontal and vertical bars.
- Convert the result to lp/mm using the USAF 1951 spatial-frequency relationship.
- Interpret the result in the context of magnification, sensor sampling, and the complete imaging system.